
in·fo·graph·ic
/ˌinfōˈɡrafik/
noun
a visual image such as a chart or diagram used to represent information or data.
"a good infographic is worth a thousand words"
/ˌinfōˈɡrafik/
noun
a visual image such as a chart or diagram used to represent information or data.
"a good infographic is worth a thousand words"

Click the KWL chart to get started
Why infographics?

|
|
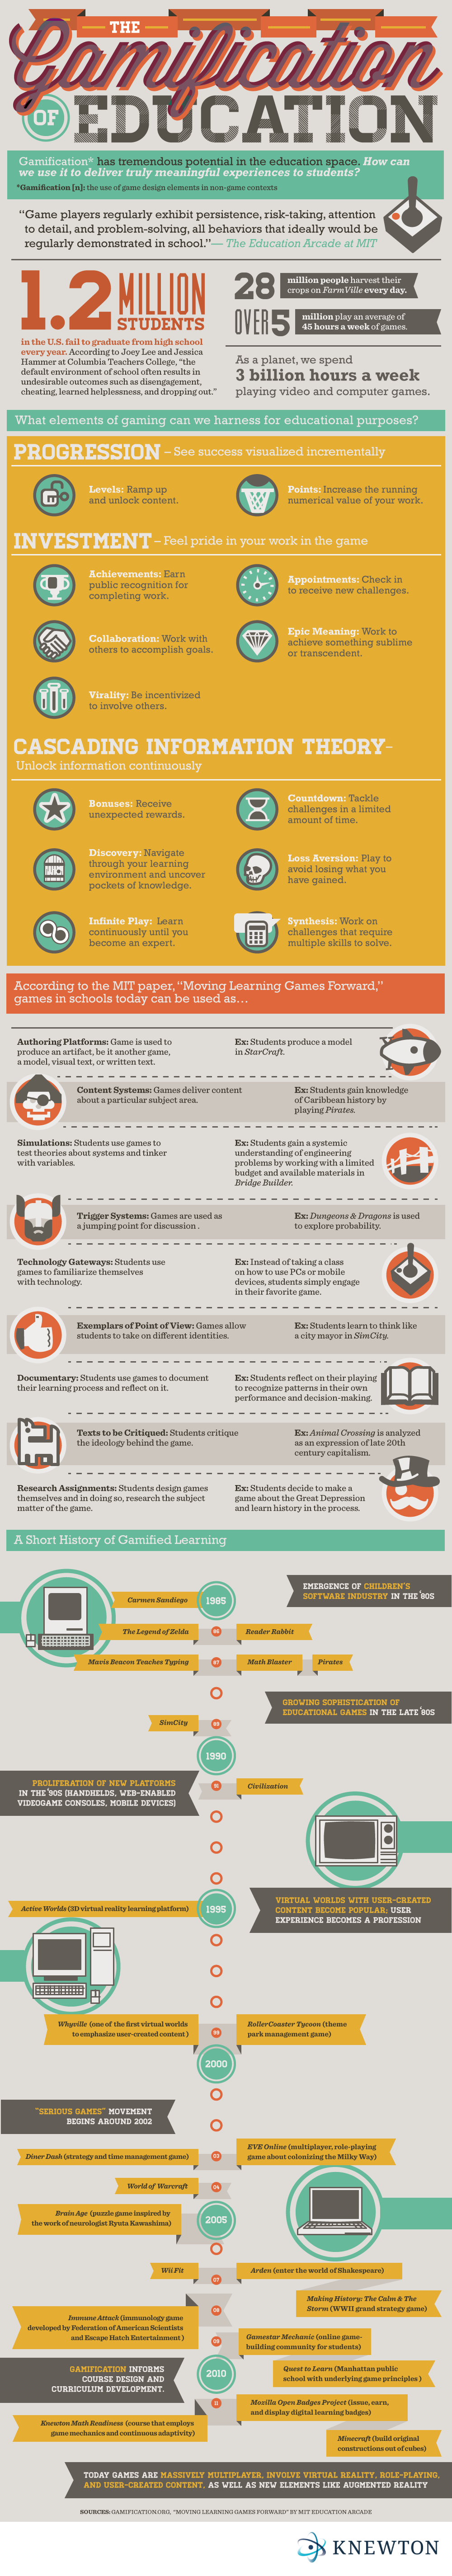
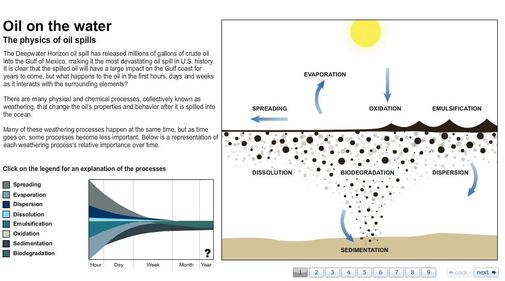
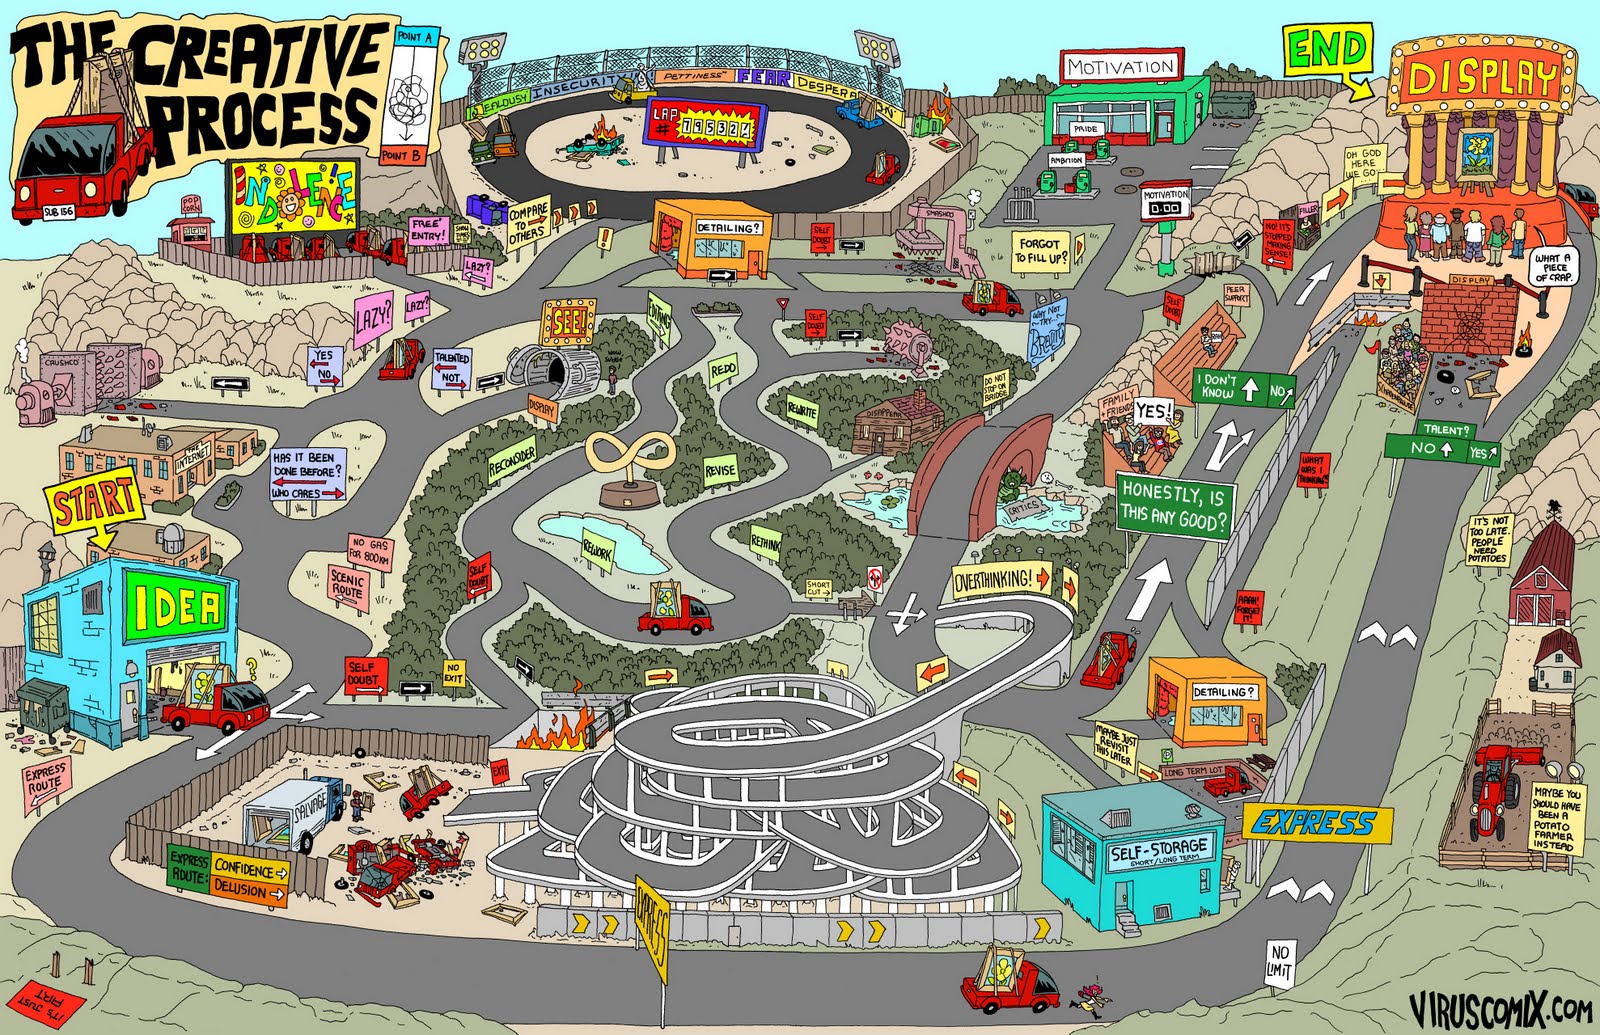
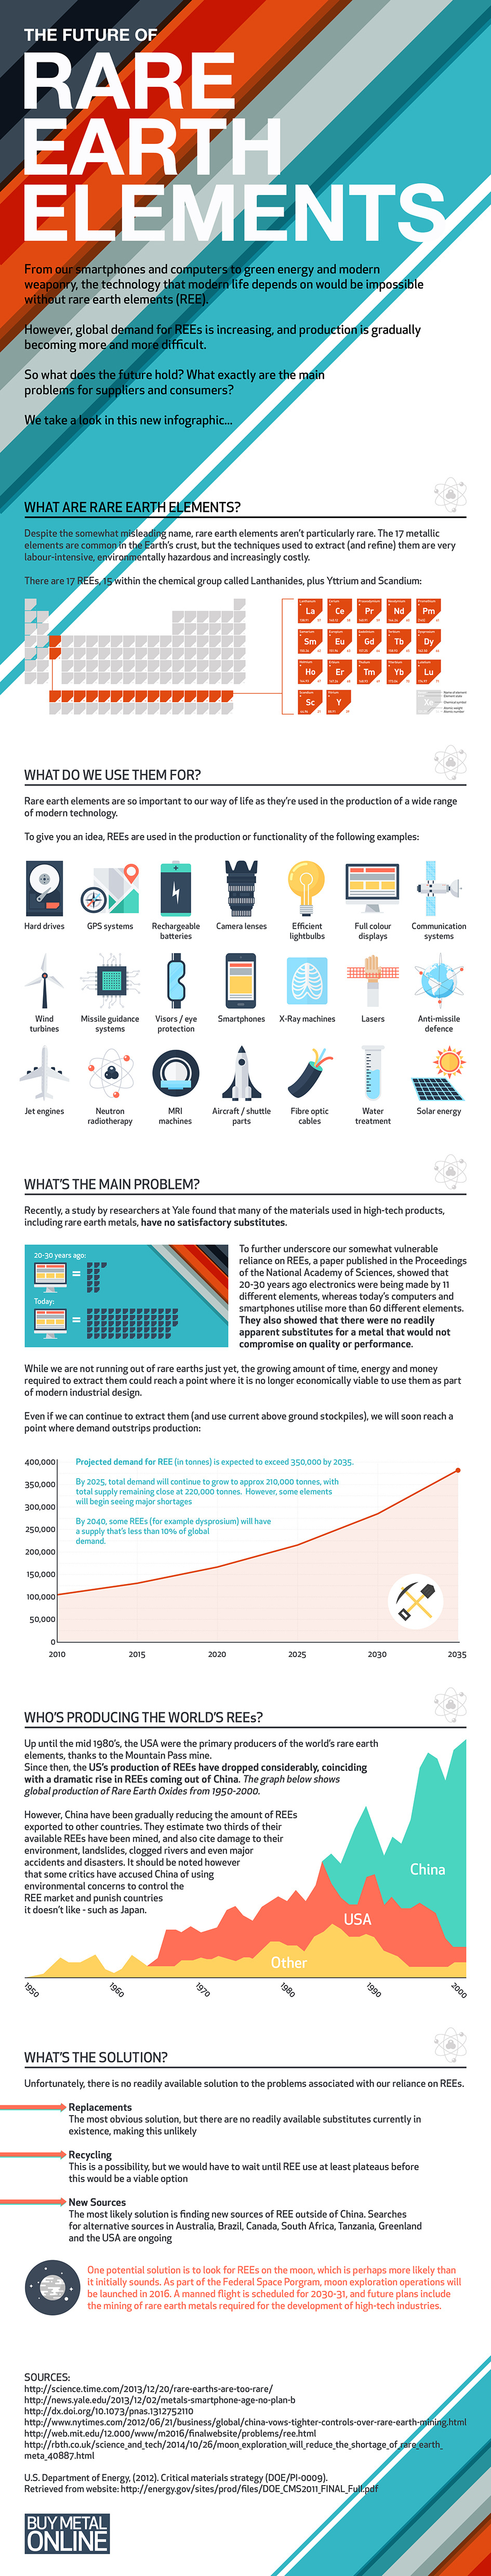
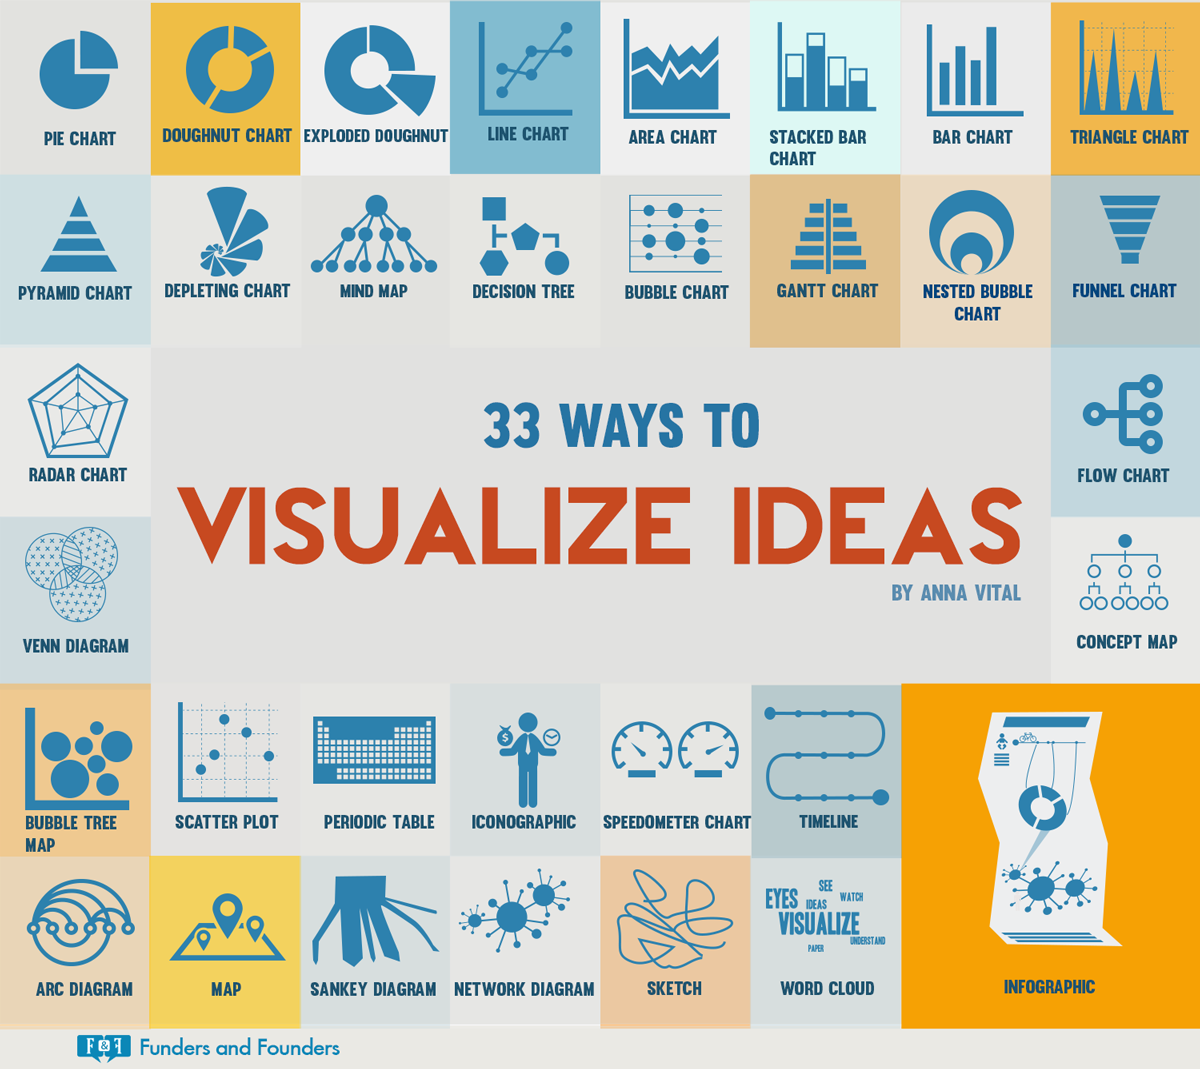
Explore examples of Infographics
- Statistical includes a summation or overview of data
- Timeline shows the progression of information over time
- Process demonstrate a process, whether linear or branching
- Informational is similar to a poster, but with some data included
- Research-based compares unlike items with a known data set
- Interactive is a Web-based infographic that allows the user to have control and modify the infographic
|
|
Start Designing!

Review the standards the determine a topic:
Explore Data Sets 
|

Get your ideas down ... come up with a general plan.
|

|
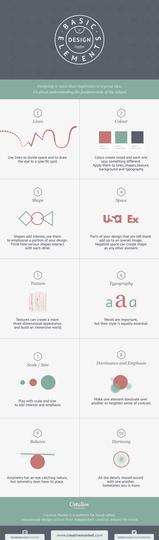
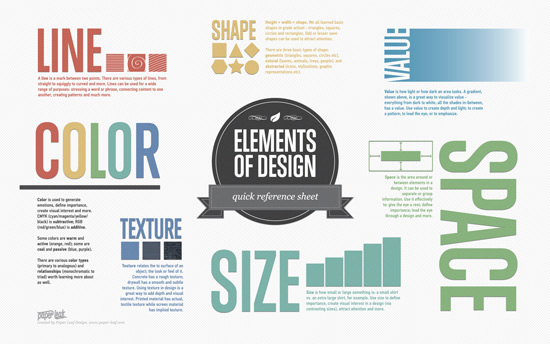
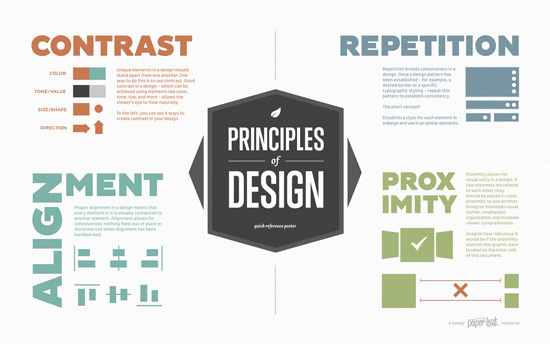
Design Elements/Principles
10 Basic Elements of Design - a short article with additional information on each design element
Online Tools
|
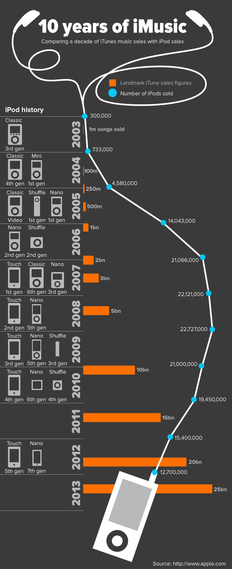
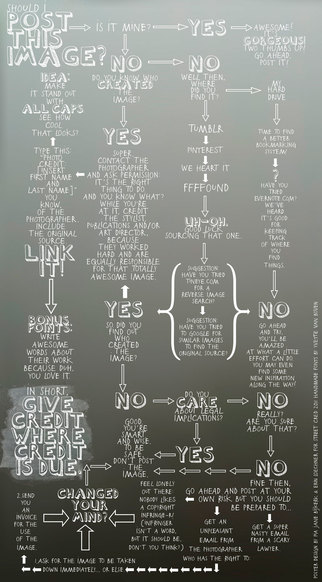
Click for a larger version
|
Quick Reference Guides from PaperLeaf.com
|

|
Infographic Generators

Additional Resources
|
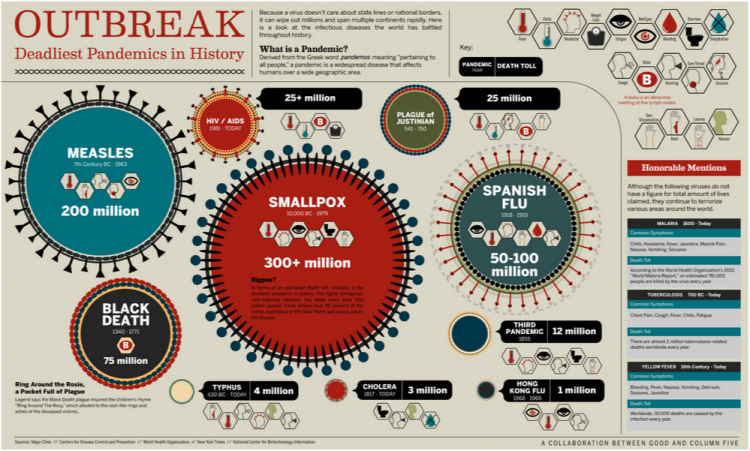
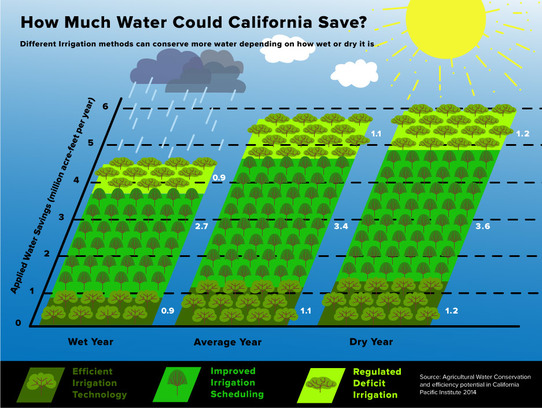
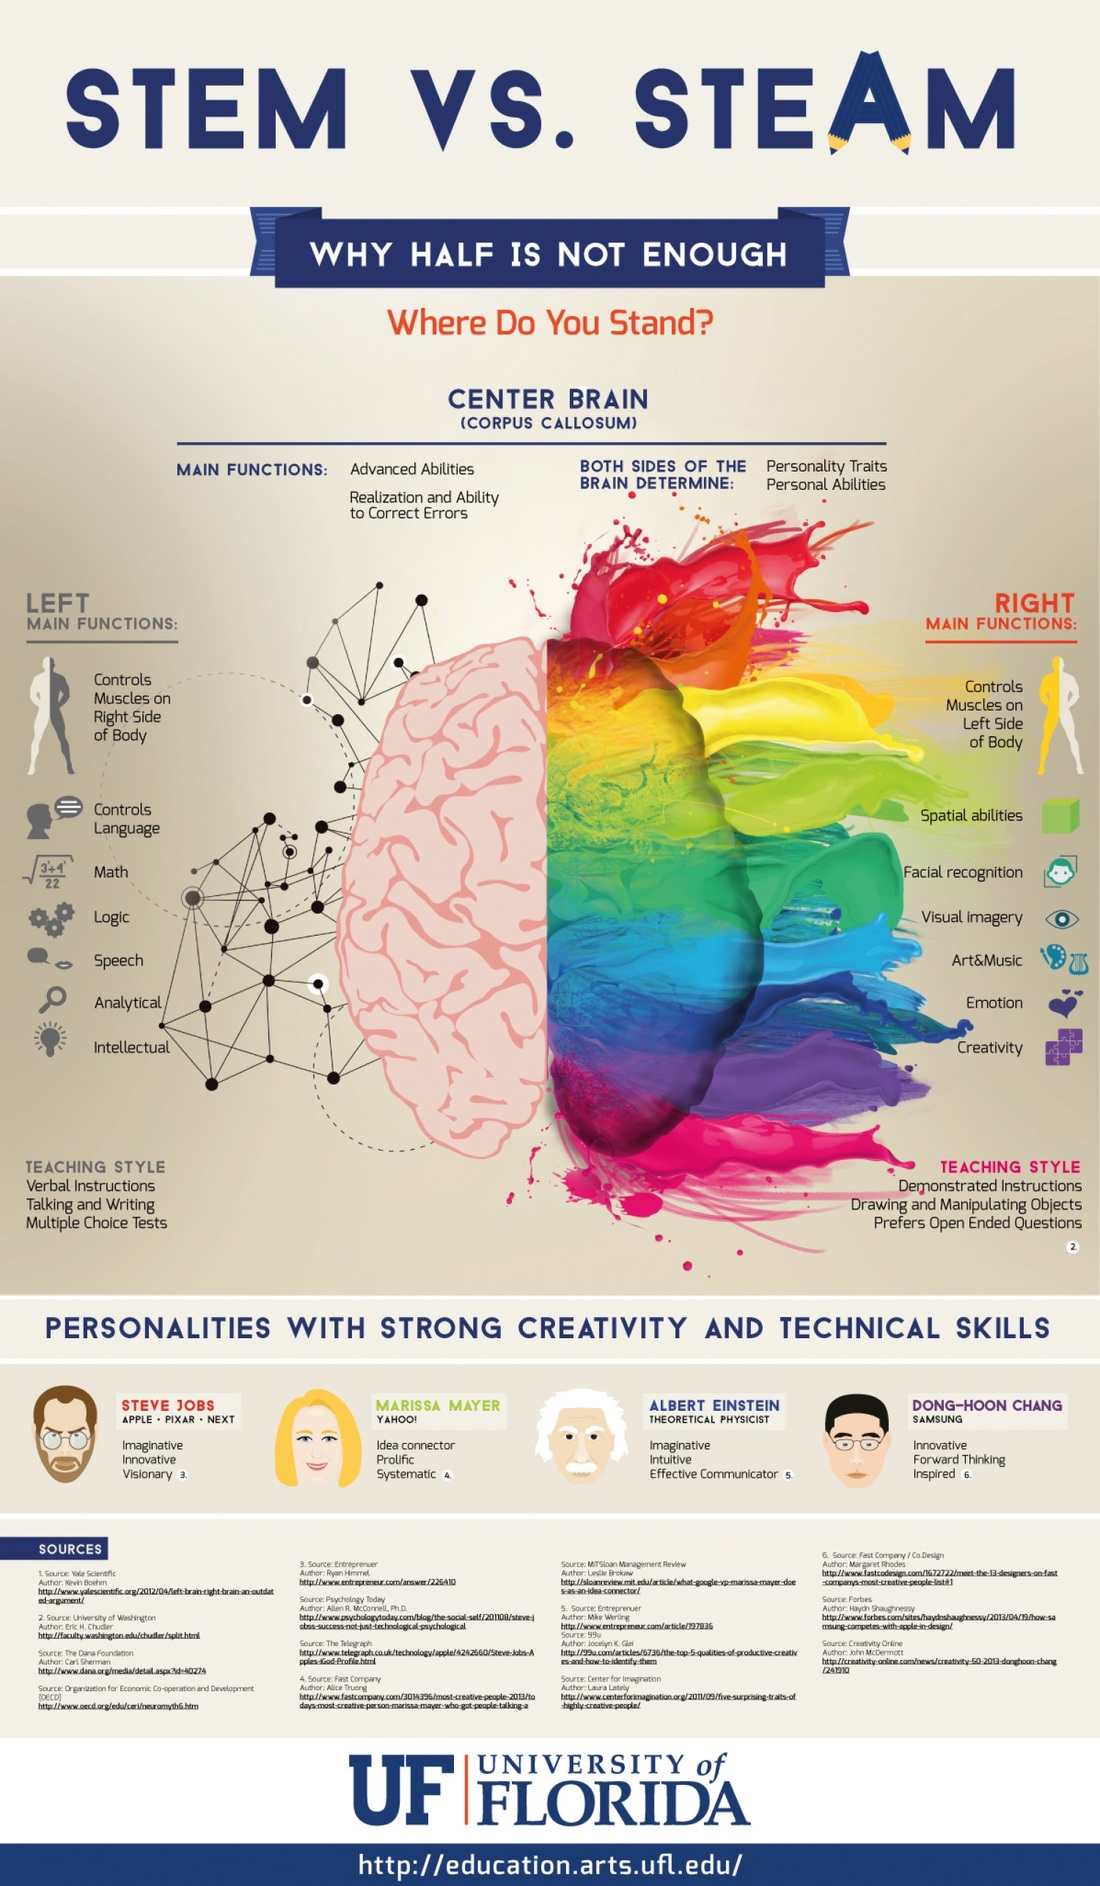
Click on image for larger version
|
|
Developed for CUE RockStar Chico (2015) and Mammoth (2016)
|

|
Interested in providing "Infographics and the Arts" to your staff?
Please contact me!
Please contact me!